

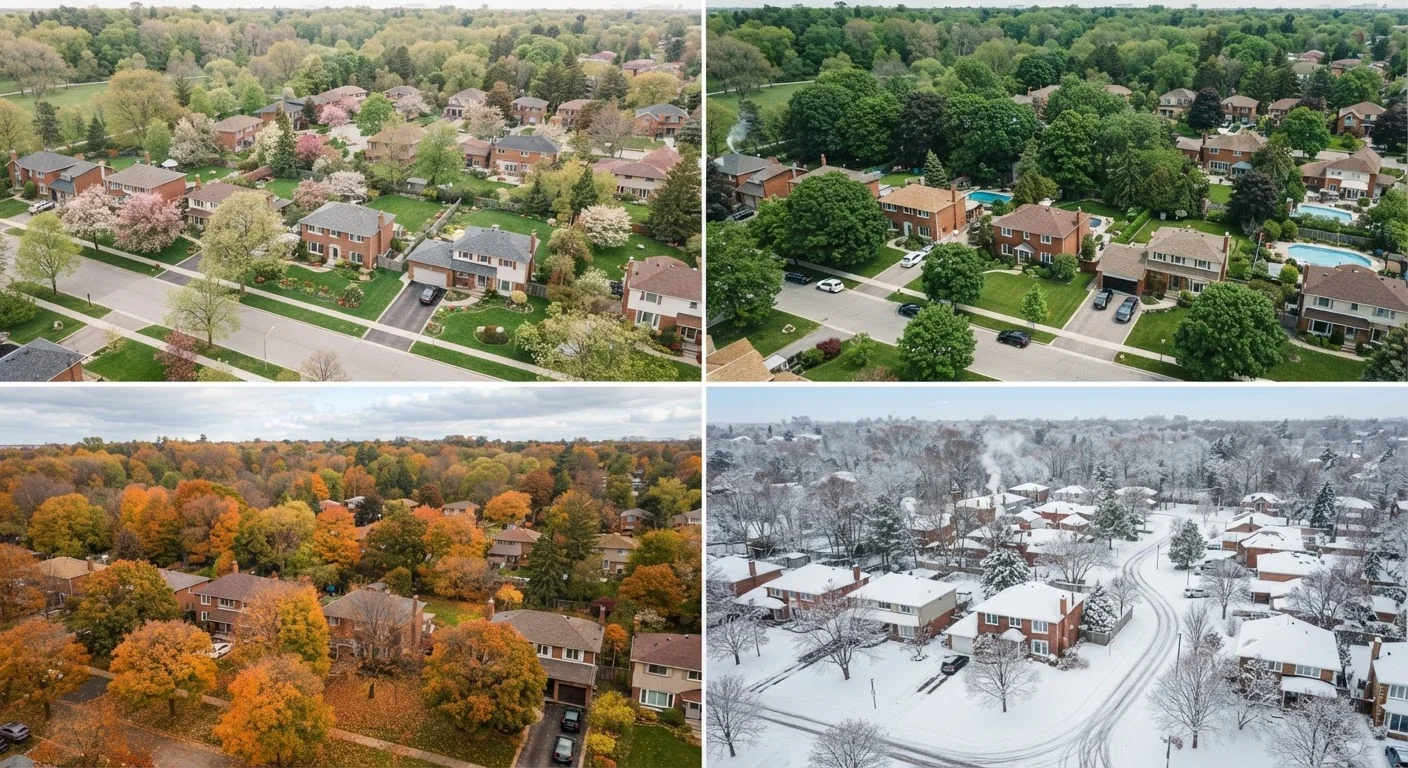
Why Real Estate Has Seasons
The housing market doesn't run at a constant pace. Like retail or agriculture, real estate follows seasonal rhythms that shift buyer and seller behavior throughout the year. These patterns aren't random - they're shaped by school calendars, weather, tax deadlines, and the psychology of major life decisions.
Understanding these rhythms won't predict exactly what will happen in your local market, but they give you a useful baseline for interpreting activity around you. For a broader look at the forces driving prices up or down beyond seasonality, see why home prices rise and fall.
Quarter by Quarter: What to Expect
Q1 - January through March: Market Reawakening
The first quarter starts slowly but builds momentum. January is typically the quietest month of the year - inventory is lean, and many buyers and sellers are still in a wait-and-see posture after the holidays. By late February and into March, buyer activity often picks up noticeably as people begin planning moves around the upcoming school year and warmer weather.
For buyers, Q1 can offer less competition than peak spring, though choice is also more limited. Sellers who list early sometimes capture serious buyers who have fewer options.
Q2 - April through June: Peak Activity
Spring is the most active period in residential real estate. More listings hit the market, more buyers are actively searching, and competition tends to be at its highest. This is when bidding wars and above-asking-price offers are most common in strong markets. Median sale prices often reach their highest point of the year during this window.
Families with school-age children anchor much of this demand - closing in spring means settling in before the next academic year begins. Whether you're buying or selling, understanding whether your local market favors one side is essential. Learn what a seller's market vs. buyer's market means for you before making a move.
Q3 - July through September: Gradual Cooling
Summer starts strong but loses steam as it progresses. July often still sees solid activity, but August and September tend to slow as families settle in ahead of the school year and buyers who didn't find a home step back. Sellers who didn't move their properties by midsummer may start reducing asking prices.
Inventory often remains relatively high this quarter, which can create better negotiating conditions for buyers still searching. Know the signals that a local market is cooling off so you can adjust your approach accordingly.
Q4 - October through December: The Quiet Quarter
The final quarter is the slowest for most markets. Listings decline, buyer demand softens, and homes that do sell often close at slightly lower prices than during peak spring months. However, the buyers who remain in the market during fall and winter tend to be highly motivated - job relocations, life changes, or financial deadlines drive their timelines.
For sellers, fewer competing listings can offset the smaller buyer pool. For buyers, reduced competition may mean more room to negotiate. This period is part of the broader market cycle explored in The Housing Market: A Complete Guide to How It Works.
Inventory
The total number of homes listed for sale in a given market at any point in time. Low inventory typically favors sellers; high inventory gives buyers more leverage.
Days on Market (DOM)
How long a listing has been active before going under contract. Rising DOM is often a signal that demand is softening or a home is overpriced.
Median Sale Price
The midpoint of all home sale prices in a given period - half of homes sold above this figure, half below. It's a common benchmark for tracking price trends without being skewed by outliers.
Seller's Market
Market conditions where demand exceeds available supply, giving sellers more pricing power and reducing buyer negotiating room.
Buyer's Market
Market conditions where supply exceeds demand, giving buyers more choice and leverage to negotiate on price or terms.
Seasonality Isn't Universal
These patterns reflect national tendencies, not guarantees. Local markets - shaped by climate, employer presence, and housing supply - can diverge significantly from the national average. A Sun Belt city with mild winters may see little slowdown in Q4, while a northern market with harsh winters can effectively pause between November and February.
Urban and suburban markets also respond differently to seasonal forces. Urban vs. suburban housing markets often behave in opposite ways, and seasonal patterns are one area where those differences show up clearly.
Finally, broad economic forces - interest rate shifts, job market changes, or housing supply constraints - can amplify or dampen seasonal effects in any given year. When market data seems to tell conflicting stories, reading a market when the data seems to contradict itself can help you make sense of the signals.
This article is for general informational purposes only and does not constitute financial, legal, or real estate advice. Market conditions vary by location and time. Consult a licensed real estate professional for guidance specific to your situation.