

Why Market Indicators Matter
Housing market data gets thrown around constantly - in news headlines, agent presentations, and neighborhood conversations. But without knowing what the numbers actually measure, it's easy to misread conditions or act on a misleading signal.
This reference guide defines the core indicators used to describe housing market activity. Whether you're tracking conditions as a buyer, seller, or renter, these are the terms you'll encounter most often - and what they genuinely tell you.
For broader context on how the market functions overall, see our plain-language housing market explainer.
The Core Indicators Defined
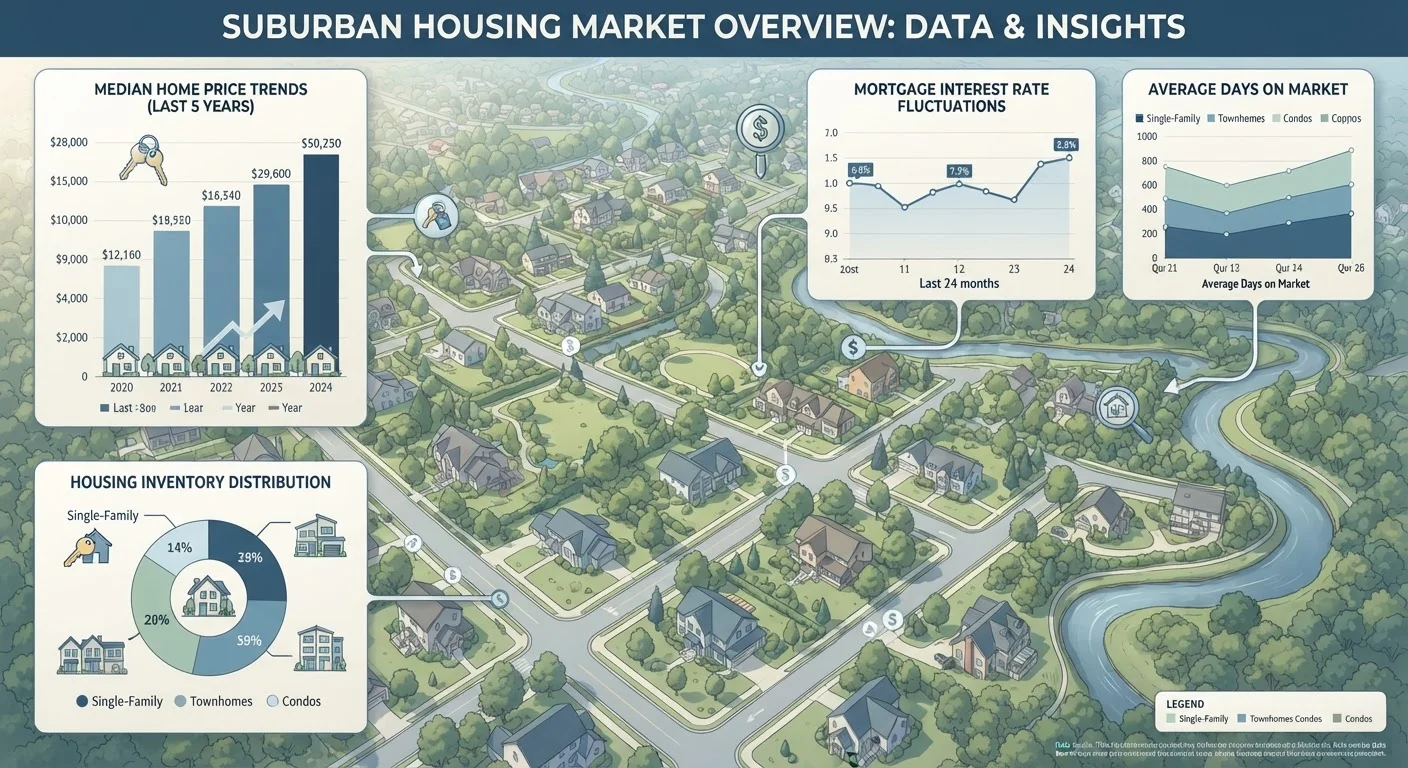
Housing Inventory refers to the total number of homes actively listed for sale in a given area at a given time. It's typically expressed as a raw count or as months of supply - meaning how long it would take to sell all current listings at the current pace of sales. Roughly six months of supply is often cited as a marker of a balanced market, though this benchmark varies by region and property type. For a deeper look, learn what housing inventory means and why it moves prices.
Days on Market (DOM) counts how long a listing has been active before going under contract. A low average DOM suggests strong buyer demand; a rising DOM can signal softening interest or overpricing. Be aware that some listings are withdrawn and relisted, which can reset the counter - so DOM doesn't always tell the whole story.
Median Sale Price is the midpoint of all sale prices in a given period - half of homes sold above it, half below. It's more resistant to distortion from outliers than the average (mean) price, which is why it's the standard reporting metric. A rising median doesn't necessarily mean your specific neighborhood or price tier is appreciating at the same rate.
List-to-Sale Price Ratio compares what sellers ask to what buyers actually pay. A ratio above 100% means homes are selling over asking - a sign of competitive conditions. A ratio below 100% indicates buyers have more room to negotiate.
Absorption Rate measures how quickly available homes are being purchased. It's calculated by dividing the number of homes sold in a period by the total number of active listings. A high absorption rate favors sellers; a low one gives buyers more leverage.
How to Use These Indicators Together
No single metric tells the full story. Low inventory paired with a high absorption rate and a rising list-to-sale ratio points to a competitive seller's market. Conversely, growing inventory, longer days on market, and ratios trending below asking price suggest buyer conditions are improving.
It's also critical to look at local data, not just national averages. A national uptick in median prices may mask cooling in specific metro areas - and vice versa. Common assumptions that lead people to misread the housing market often stem from treating aggregate numbers as local facts.
Once you're comfortable with these definitions, the next step is applying them to actual reports. How to read a local housing market report without getting lost offers a practical walkthrough. For the full picture, this article is part of a complete guide to how the housing market works.